Black History Data Visualization

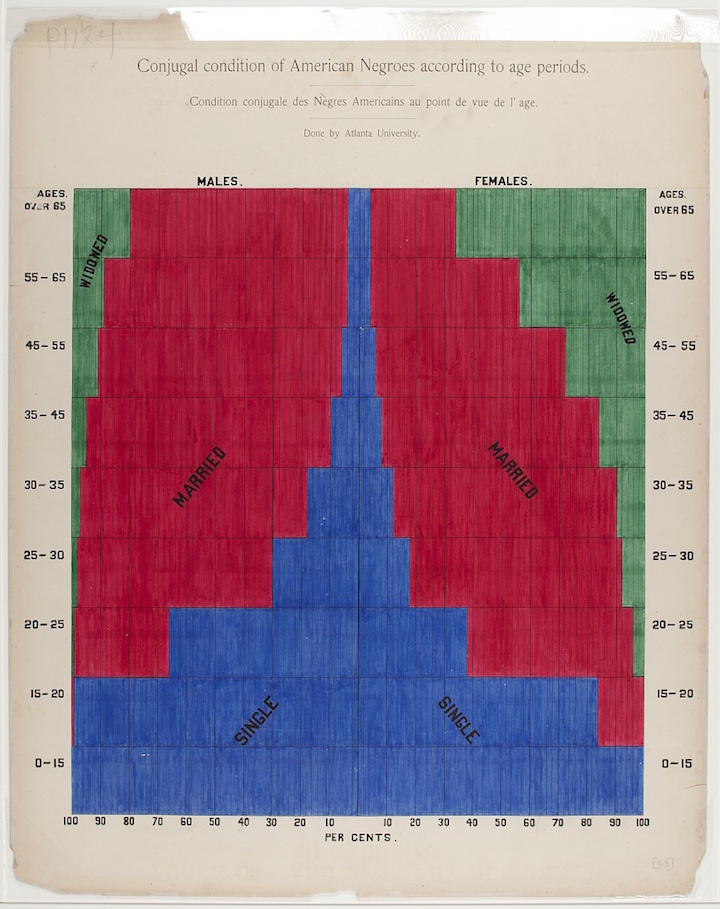
In honor of Black History Month, we are reposting this hand-drawn visualization of demographic data created by W. E. B. Du Bois in the year 1900. You can find more such turn-of-the-century data visualizations here. (Hat tip: digg.)

33915v

Credit: W. E. B. Du Bois

About F. E. Guerra-Pujol

When I’m not blogging, I am a business law professor at the University of Central Florida.
This entry was posted in Culture, Economics, History, Science. Bookmark the permalink.

2 Responses to Black History Data Visualization

  1. Abogada Guerra says:

    Thank you for sharing!

  2. Pingback: It’s Black History Month! | prior probability

Leave a Reply

Fill in your details below or click an icon to log in:

WordPress.com Logo

You are commenting using your WordPress.com account. Log Out /  Change )

Facebook photo

You are commenting using your Facebook account. Log Out /  Change )

Connecting to %s