
Check out this excellent report by Nigel Chiwaya, a data reporter for NBC News. Mr Chiwaya’s comprehensive report contains a complete compilation of who attacked whom (and how many times) during last night’s Democratic debate as well as a cool interactive graphic (see screenshot below). Also, if you check out Mr. Chiwaya’s previous visualizations of candidate attacks during the September Democratic Debate (12 Sept. 2019) and the October Debate (15 Oct. 2019), you will see an increase in the frequency of attacks over time.
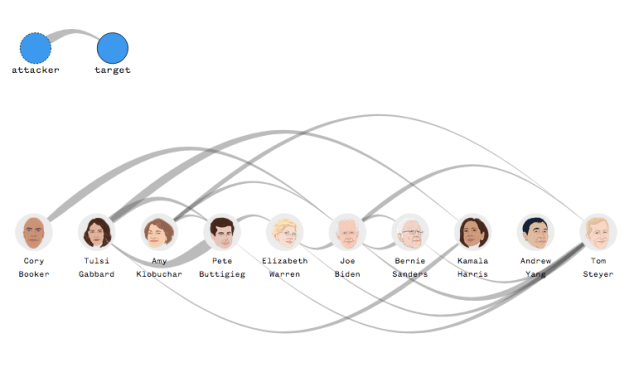
Credit: NBC News

