
Consider the following image from ESPN Stats & Info (via Twitter):
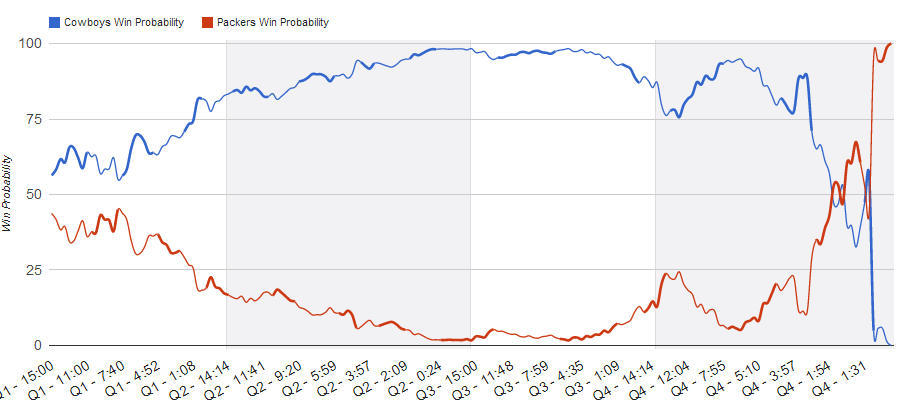
This past Sunday afternoon, the overrated Dallas Cowboys led the venerable and tenacious Green Bay Packers by a score of 26-3 at halftime, yet the Cowboys somehow blew their large lead and lost the game. So what is the probability that the Packers would make such a comeback?
Easy. The visual image above presents a Bayesian time progression of both teams’ respective “win probabilities.” Notice the Bayesian nature of this graph–the win probability of the Dallas Cowboys increases as their lead over their opponent increases and then rapidly plummets to zero towards the end of the game. That is, the image above is Bayesian because, starting with 50/50 priors, it then proceeds to update the win probabilities of the teams as the game is played in real time and as the score changes. Now, try figuring out the win probabilities of the teams using standard statistical or Fisherian methods and see how far that takes you. You can’t, really, because each game in sports is a unique event, played only once.

