Posted in Uncategorized | Leave a comment

Visualization of retail creative destruction


Jeff Desjardins poses the following question in this report: “What has more value: all major publicly traded department stores in the United States, or Amazon?” The answer is Amazon. In the words of Mr Desjardins: “Add together the market caps of Walmart, Target, Best Buy, Nordstrom, Kohl’s, JCPenney, Sears, and Macy’s, and they amount to a significant $297.8 billion. However, it’s not enough to beat the Amazon machine. The online retailer alone is worth $356 billion, making it one of the largest companies by market capitalization in the world.”

Also, what a difference ten years make: “Ten years ago, the future of brick and mortar retail sill looked bright. The aforementioned retailers were worth a collective $400 billion, and Amazon was only valued at $17.5 billion.”

Posted in Uncategorized | 4 Comments

Visualization of an anomaly

Hat tip: Cliff Pickover

What’s wrong with this picture? Read about this visual paradox here.

Posted in Uncategorized | 2 Comments

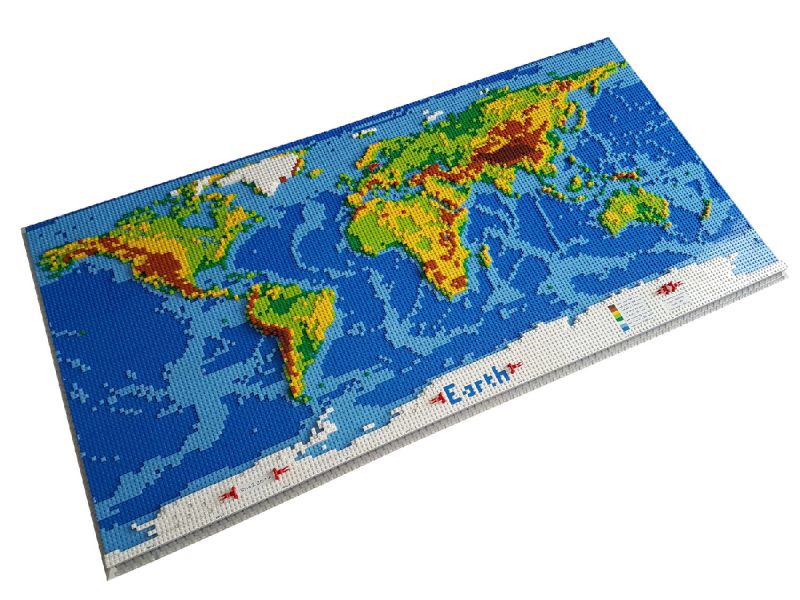
Lego world map

Credit: dirkb86

Dirk B. created a scale map of the world out of LEGO bricks. You can read more about his project here and here.

Posted in Uncategorized | Leave a comment

The war against children

We’ve heard many fancy restaurants are starting to ban children, but did you know that Apple Park, Apple’s massive $5 billion spaceship campus (pictured below) consisting of 2,800,000 square feet, doesn’t have a single childcare facility. More here, via CNET. (Hat tip: Ryan Tate.)

Image result for new apple campus

Posted in Uncategorized | Leave a comment

“The nature of their quarrel remains unknown”

Model this.

Posted in Uncategorized | Leave a comment

Mathematics and mathematicians on Twitter

The full list is available here.
Posted in Uncategorized | 4 Comments

Rule evasion (I-95 edition)

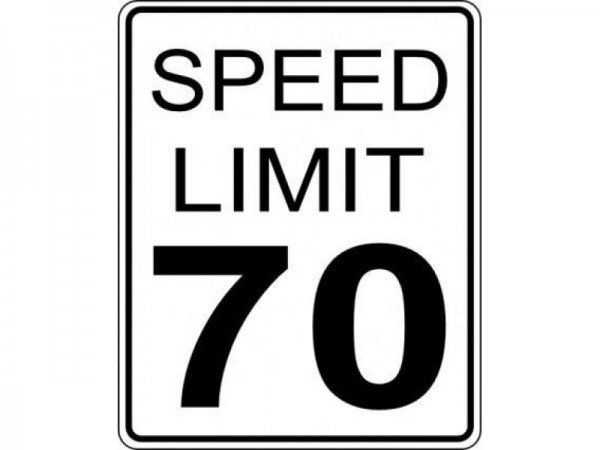
My wife and I took turns driving from Orlando, Florida to Savannah, Georgia via various interstate highways earlier today in order to attend the annual meeting of Academy of Legal Studies in Business (#ALSB): I-4 East to I-95 North to I-16 East. There was light traffic most of the way, and I noticed that most (if not all) motorists, including ourselves, were driving at least 10 to 20 miles per hour in excess of the posted speed limits, depending on whether the speed limit was 60 or 70 mph. In other words, rule evasion, far from being some rare occurrence, is the norm, at least when traffic is light! (By the way, doesn’t my contagion model of rule evasion explain this behavior? If driver A sees driver B speeding (and getting away with it), then A should be more likely to speed himself.) So, how common is rule evasion in other domains of life?

Image result for 70 mph speed limit
Posted in Uncategorized | 2 Comments

Tom Brady’s footballs (part 7): some problems with the contagion model

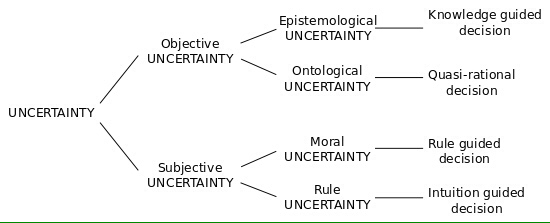
We presented our contagion model of rule evasion in our previous post. Here, however, we shall point out some flaws with our model. To begin with, our model implies that actors are either law-abiding or law-evading, when in reality, actors might adopt a mixed strategy, i.e. complying with probability p and evading with probability 1 – p. Another flaw is that our model does not specifically take into account detection uncertainty or legal uncertainty. In reality, we would expect the levels of such uncertainty to have an effect on the little c and T variables in our model, i.e. on the background rate of compliance and on the transmission rate. In any case, we are not sure why some models distinguish between detection uncertainty and legal uncertainty. So, we need to find a way of incorporating uncertainty in our contagion model, although we would lump both forms of uncertainty together.

Happy birthday Adys Ann!

Posted in Uncategorized | Leave a comment

Tom Brady’s footballs (part 6): a contagion model of rule evasion

In our previous post, we proposed the possibility of a “contagion model” of legal evasion, noting that such a model is plausible given that people tend to copy or imitate what other people are doing. Here, we present the details of our model. We start with a finite population of actors consisting of some number of law evaders and of law abiders as follows:

  • Let n be number of people in a given population.
  • Let et be the number of law evaders in population n at time t.
  • Let n – et be the number of law abiders at time t.
  • Let C (big C) be the level of contact between people in the population.
  • Let Τ be the contagion or transmission rate; i.e. the likelihood that a law abider will become a law evader.
  • And let c (little c) be the natural or constant level of compliance in the population.

As a result, c × et is the compliance rate; i.e. the rate at which law evaders become law abiders, and n × C is the contact rate; i.e. the rate at which the members of a population meet or come into contact with each other. (Note: the variable big C is what distinguishes our contagion model from information cascade models, which assume that the public behavior and decisions of all actors are common knowledge. In our contagion model, by contrast, each actor meets (and thus observes) a limited number of fellow actors, depending on the value taken by big C.)

Given these variables and parameters, we now present the logic of our contagion model as follows:
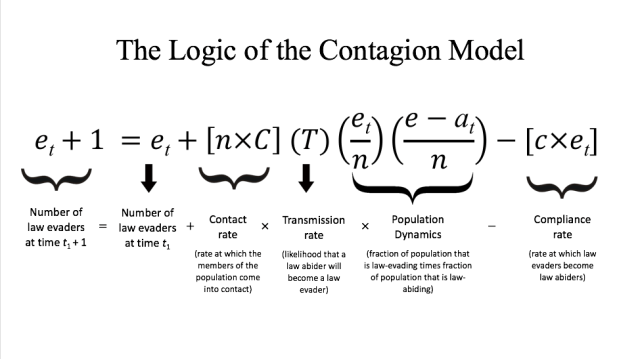
Screen Shot 2017-08-05 at 4.06.20 PMThankfully, our contagion equation above can be simplified through algebraic manipulation as follows:

et + 1 = et + et × {C × T × [(n – et)/n] – c}

Notice that as the variable et approaches zero, the (n – et)/n term in the equation above approaches 1, so the model can be further simplified as follows:

et + 1 = et + et × [C × T – c]

As a result, our model tells us that law-evading behavior will spread when C times T > c. In words: when the contact rate times the transmission rate is greater than the rate of compliance, law-evading behavior will spread through the population because the number of law abiders changing their behavior as they come into contact with law evaders is greater than the natural rate of compliance in the population.

But what are the values for C, T, and c? Broadly speaking, we would expect these parameters to vary depending on the actual population of actors we are modelling. By way of example, we would expect big C, the level of contact, to be high in a mobile and modern population and low in a rural or pre-modern population. Moreover, we would expect T, the transmission rate, to vary depending on the ratio of law abiders to law evaders in the population, and we would expect little c, the level of compliance in a population, to depend (endogenously) on the general level of trust in a given population and (exogenously) on the levels of detection uncertainty as well as legal uncertainty. In our next post, we will consider the interaction between both types of uncertainty: detection uncertainty and legal uncertainty.

Posted in Uncategorized | 4 Comments